More Work · Early digital concept
AquaScope
From Marine Observation to Further Learning
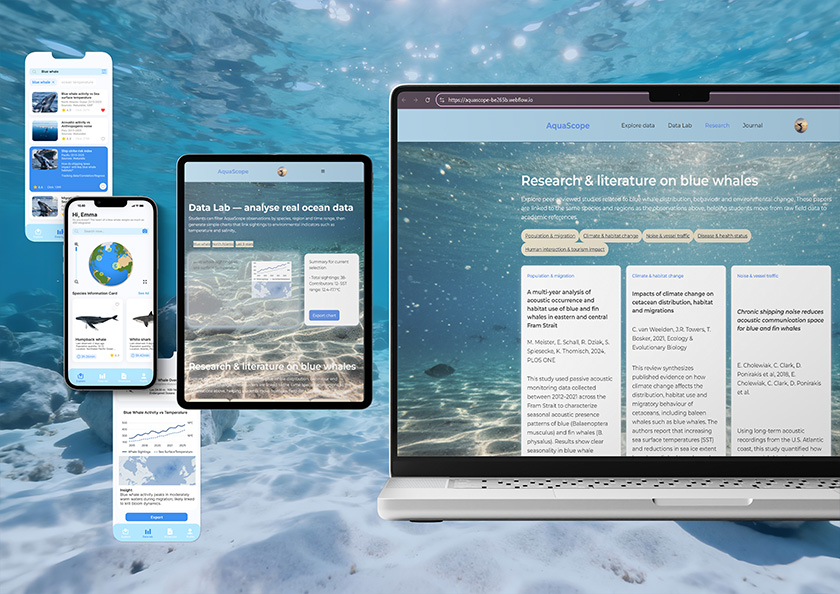
AquaScope is an early digital platform concept for marine learners. It connects species observations, environmental context and research resources to help students continue learning from a discovery.
 View full image ↗
Research and design opportunity
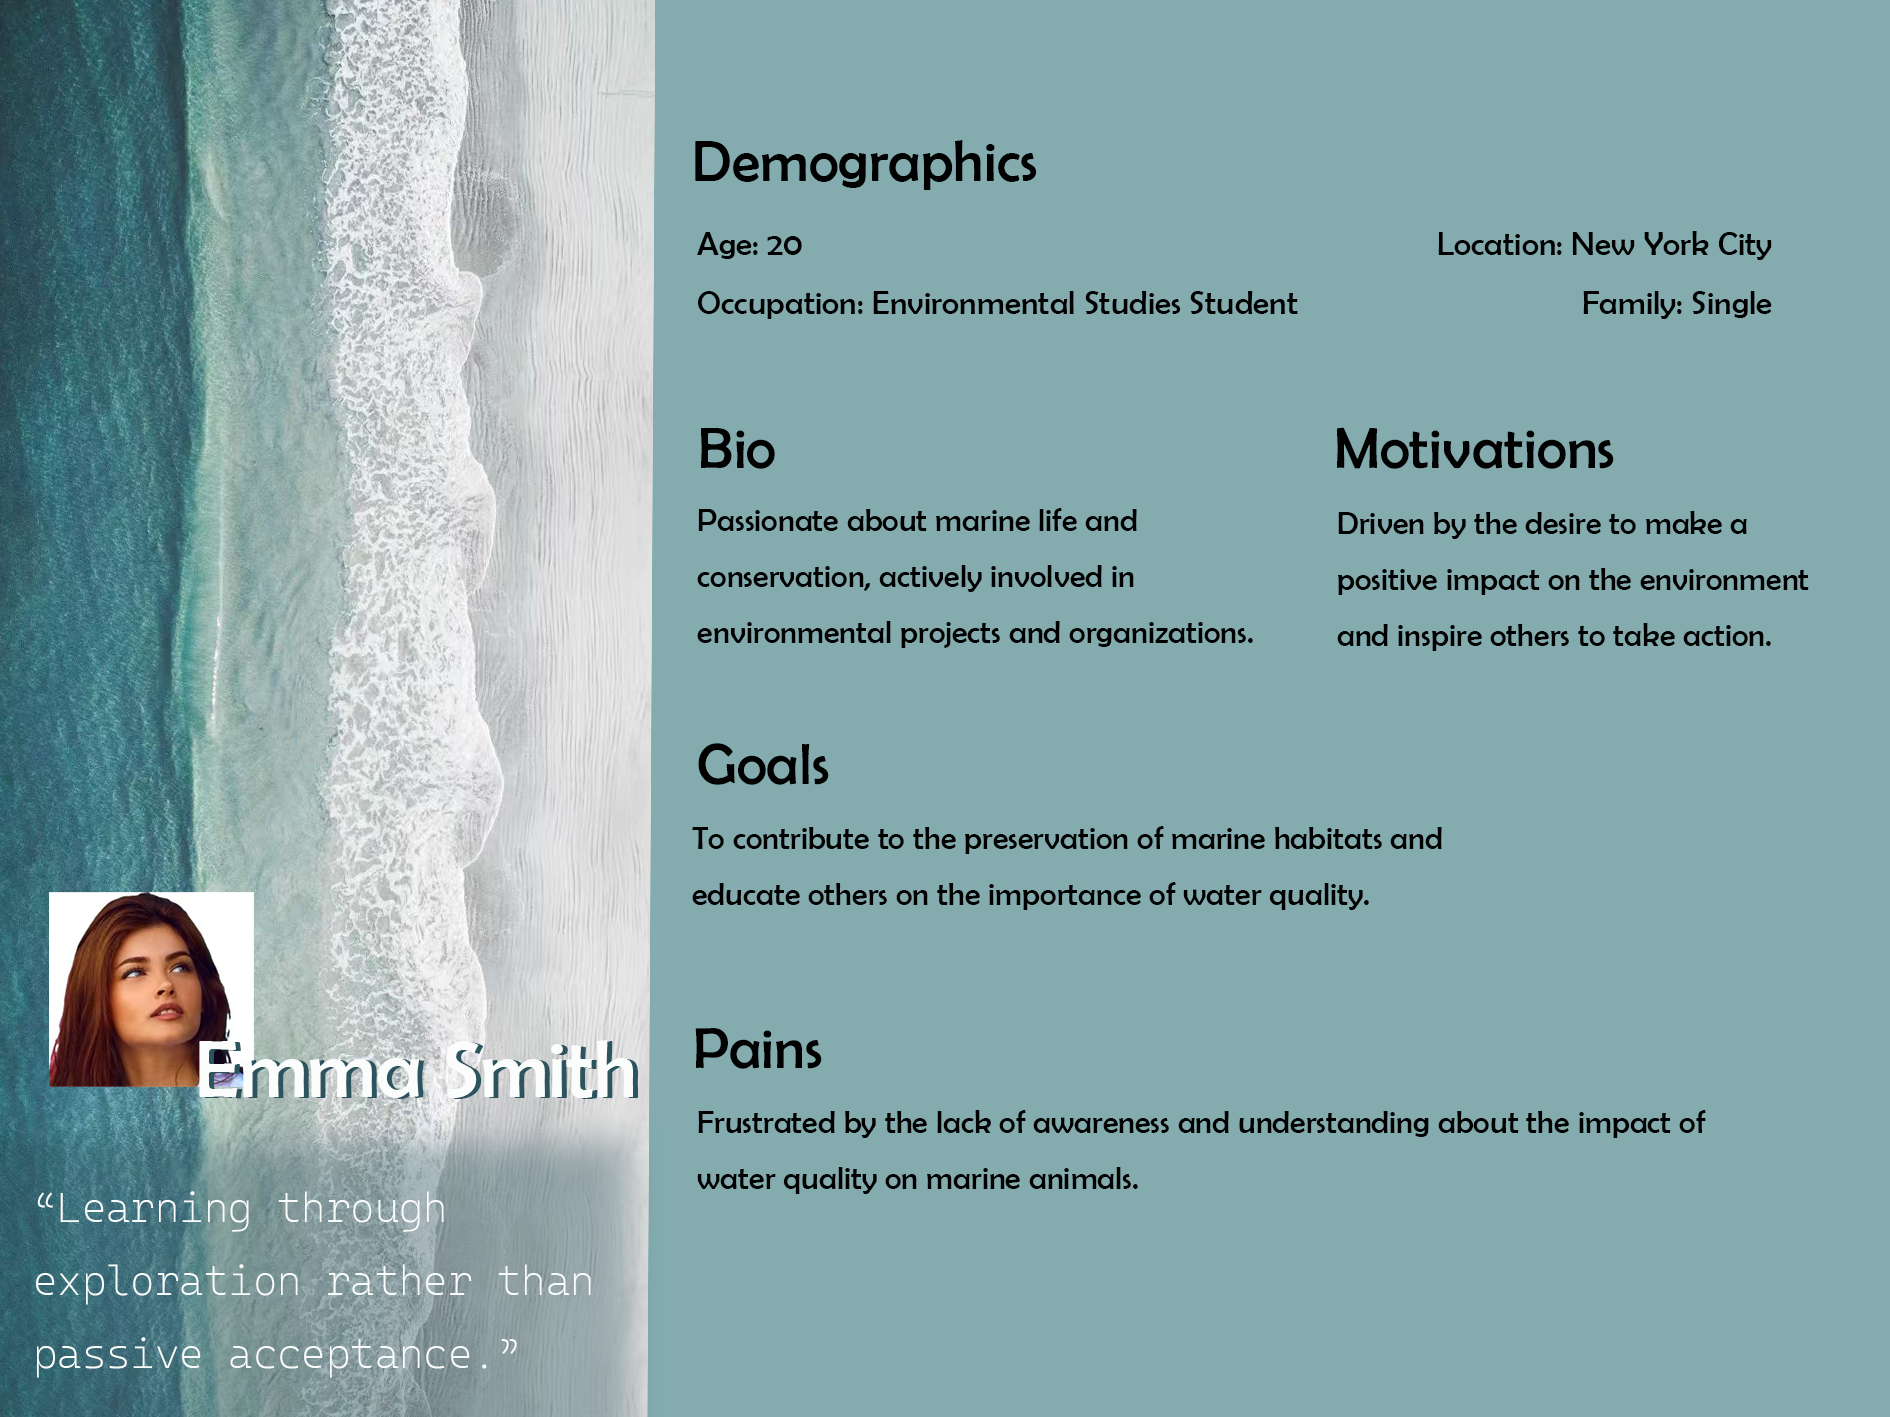
In the course interviews, inaccurate species identification and incomplete information came up as concerns. When mapping students’ research journeys, I also found that searching for data across sources, checking information and organising materials took considerable time.
The difficulty is connecting an observation, its context and credible research—not simply finding more information.
 View full image ↗
User journey and problem framing
 View full image ↗
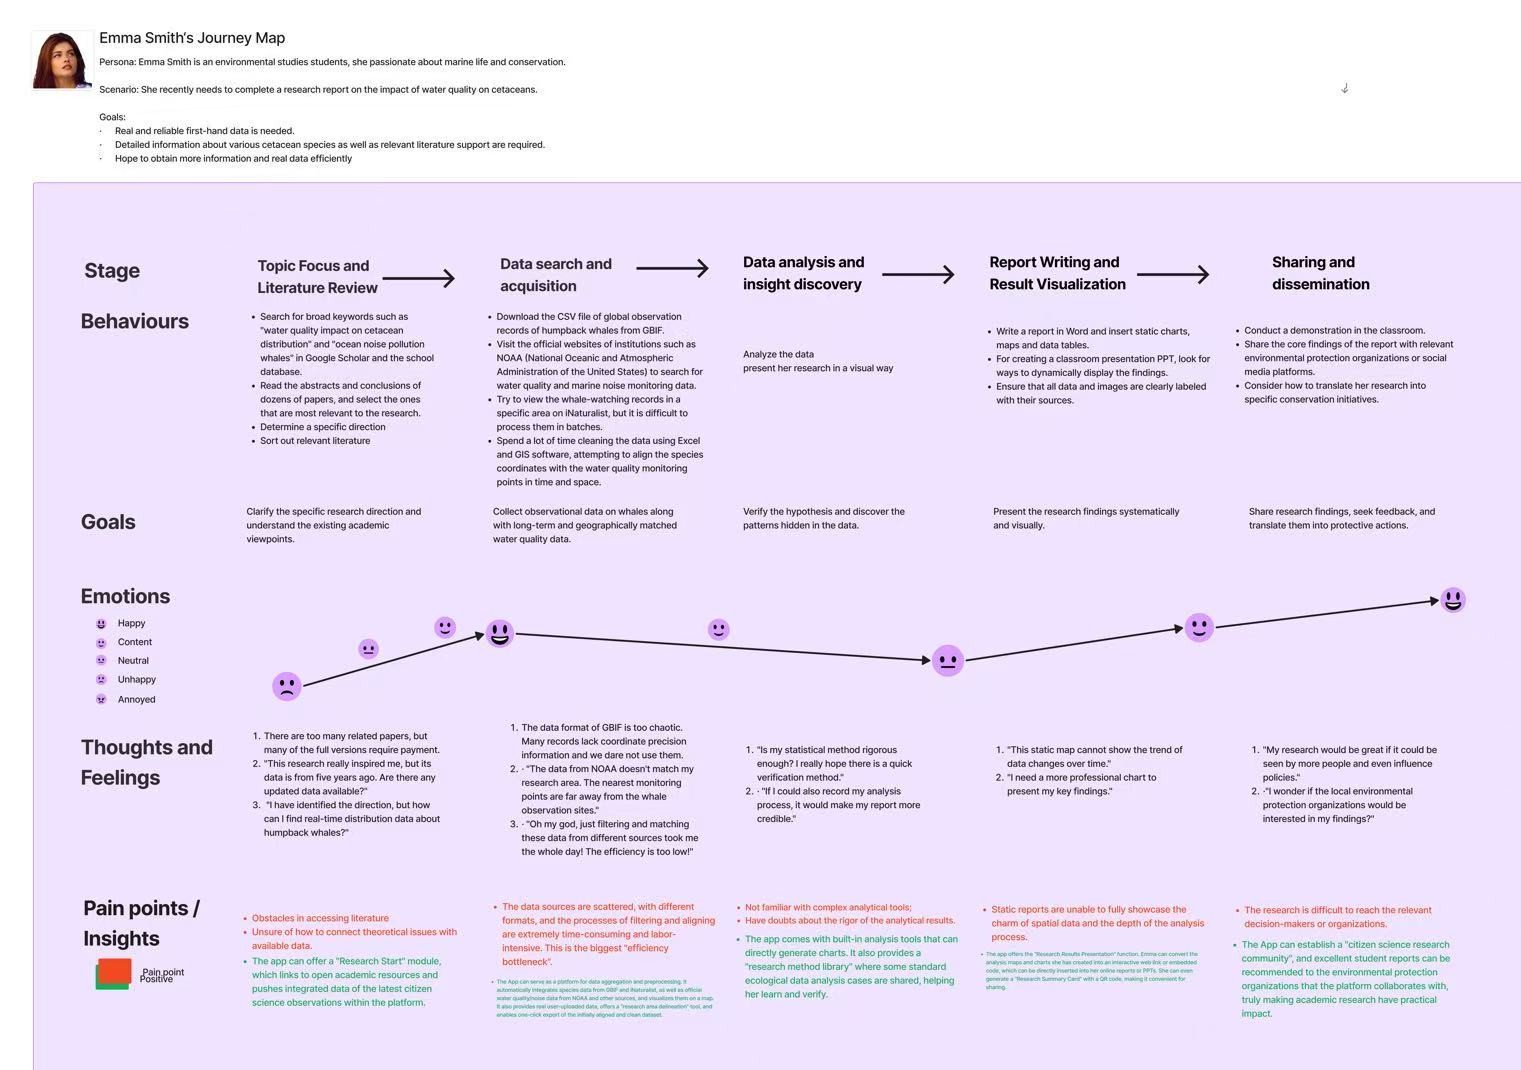
This journey map follows a student from finding sources and gathering data to analysis and report writing. I noticed that scattered sources and checking the data took considerable time, which led me to consider how observations and research resources could be connected more clearly.
Core path and early prototype
Marine enthusiasts can contribute observation records, while students can start from existing records, view their context and continue reading related research. Observers take photographs and contribute field records. The three steps below describe a concept for students; they do not imply that all features have been developed.
- 01
Browse observations
Start with a species or an existing observation record.
- 02
Check the context
View the observation time, location and available environmental information.
- 03
Continue learning
Read related research and organise study notes.
 View full image ↗
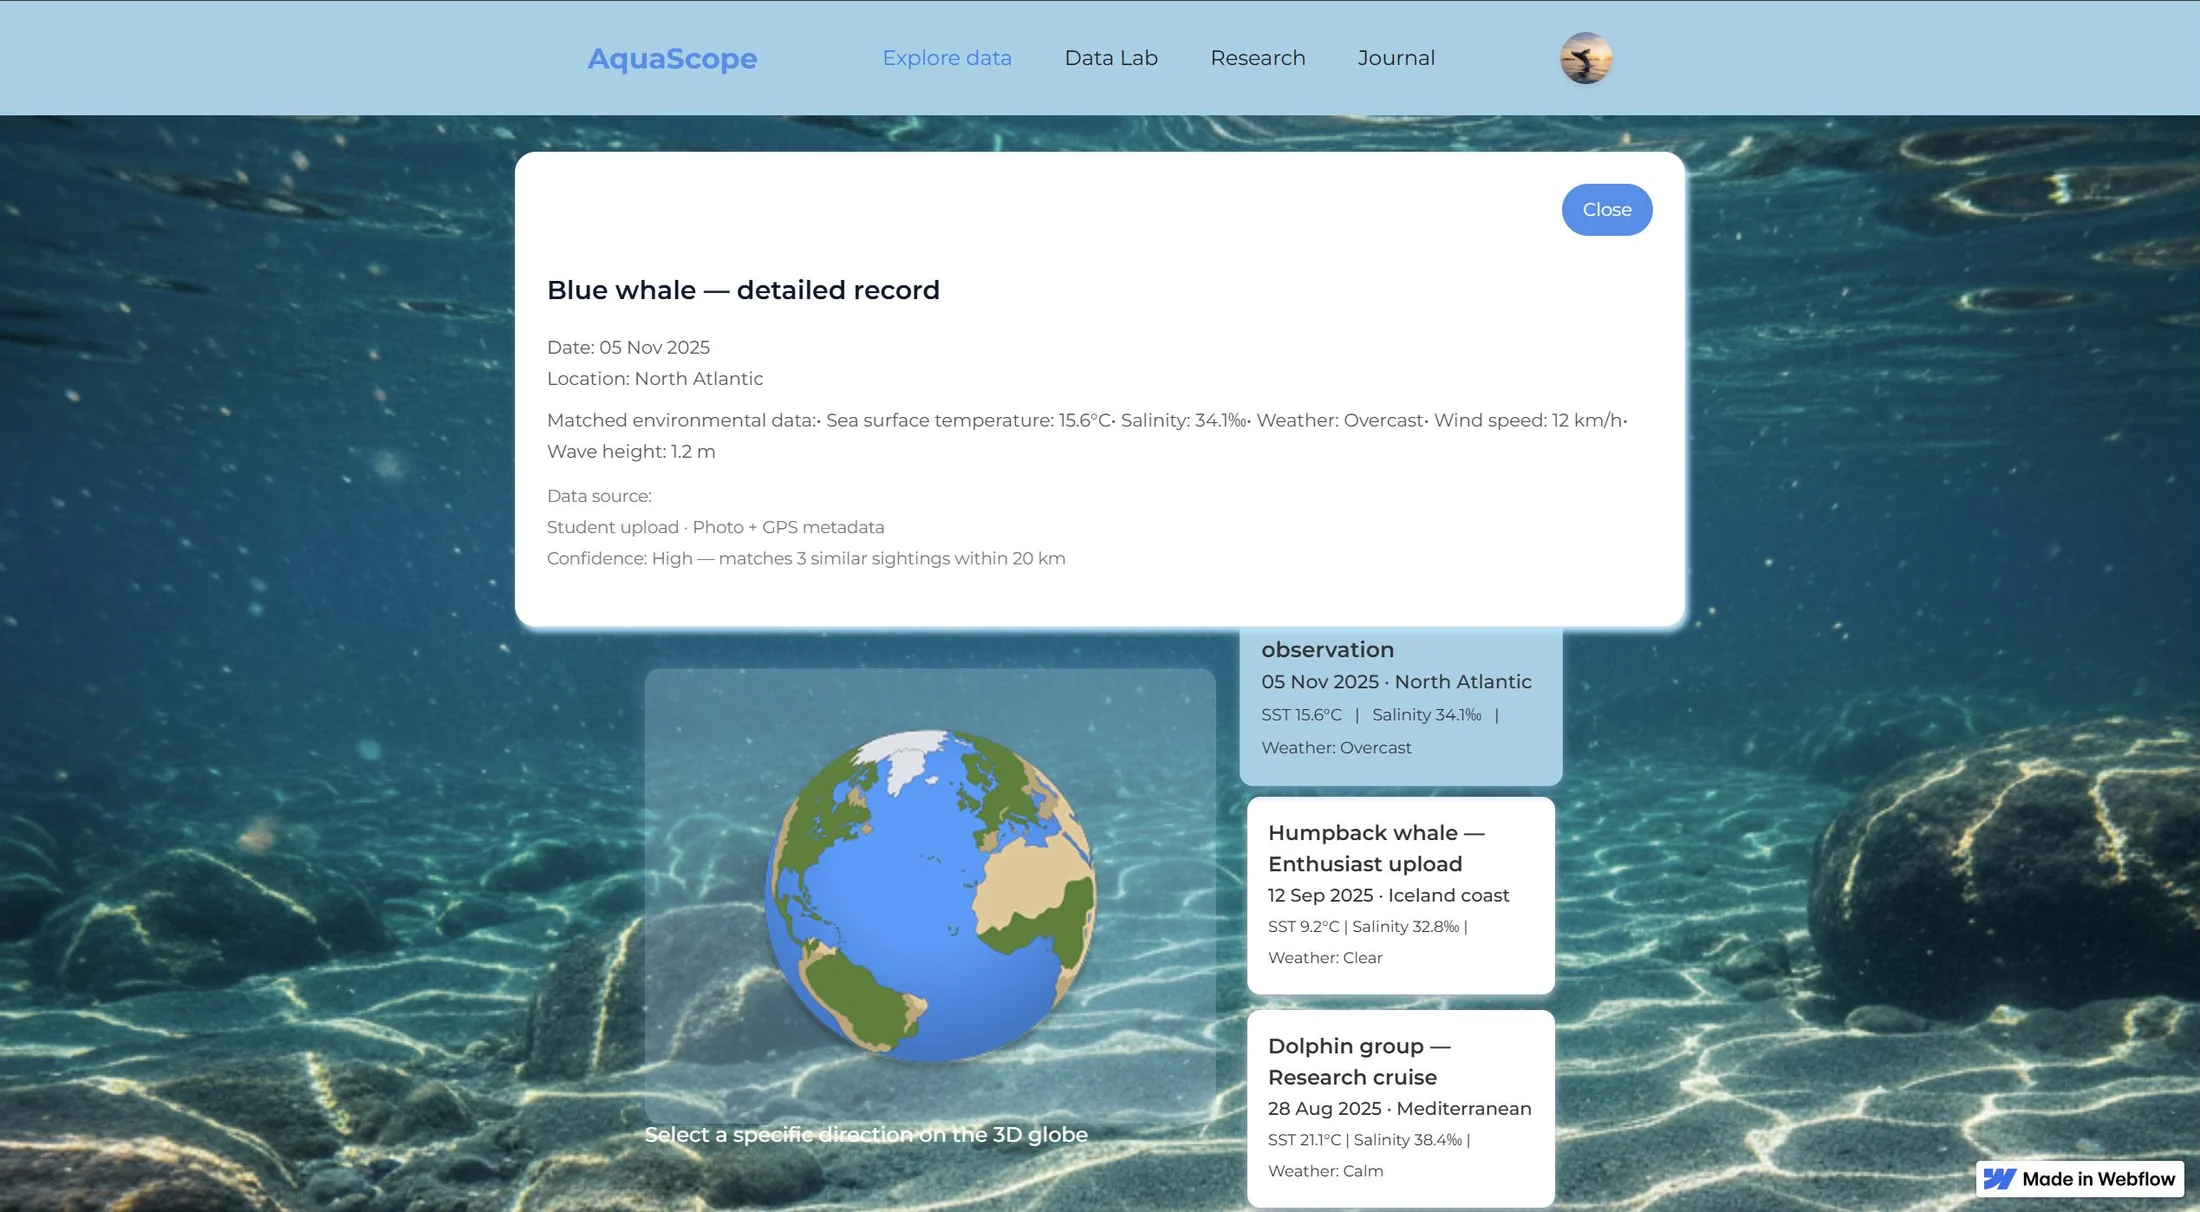
Observation detail · Early Webflow prototype
This early Webflow prototype brings species information, observation time, location and related context together.
The values and confidence labels only illustrate the design approach; they do not come from a verified data API.
Looking back
This was one of my earlier digital product exercises. I tried to organise scattered marine observation records and research materials into a learning path, and built a web prototype in Webflow.
Looking back, some basic questions remain unresolved: how accurate species identification is, where environmental data comes from, and how to protect observers’ location information. If I continued the project, I would investigate these questions before adding more features.